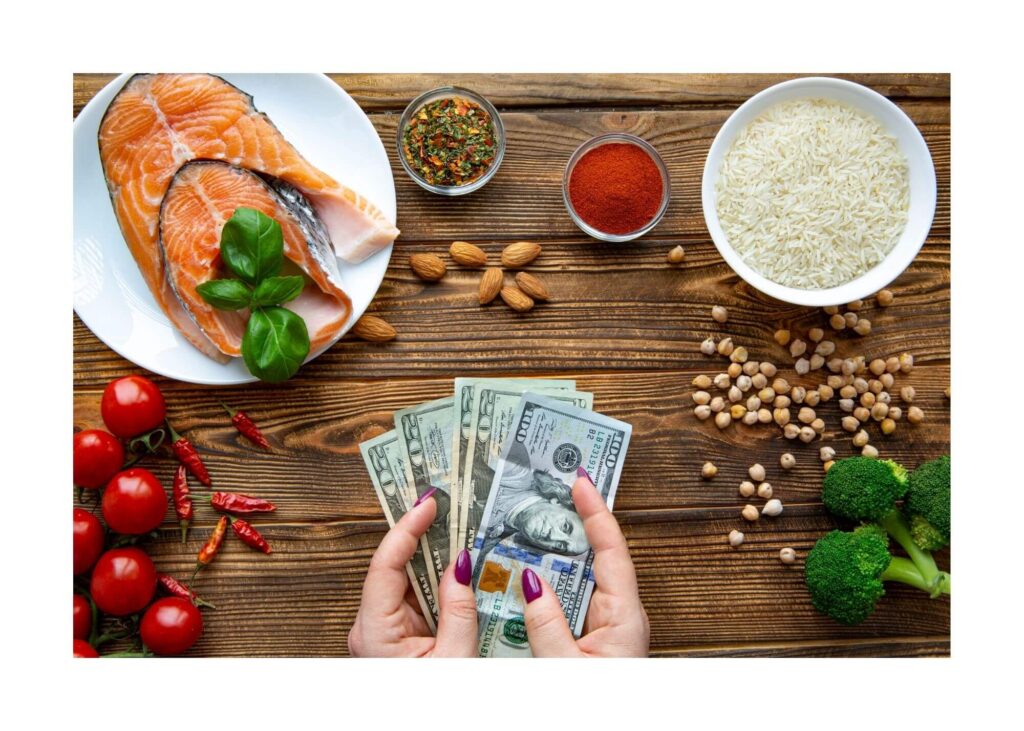
Where does your food dollar go?
Transporting, processing and packaging farm-grown foods so they’re ready to be enjoyed on our tables costs significantly more today compared with the recent past. The farmers’ share of the retail food dollar is as low as 2% to 4% for bread and cereal, and as much as 35% for some fresh market products.
Farmers and ranchers receive less than 15 cents (on average) out of every retail dollar spent on food that is eaten at home and away from home. In 1980, farmers received 31 cents out of every retail dollar spent on food in the United States. The farm share in a dollar food purchase is higher for food consumed at home, compared to food consumed away from home – 24 cents VS only 4 cents.
Off farm costs such as marketing, expenses associated with processing, wholesaling, distributing and retailing of food products, account for 85 cents of every retail dollar spent on food
Bottom line – your retail food dollar: 85% off the farm and only 15% on the farm!
Farmers’ expenses continue to rise!
For 2017, farm-level production expenses were 35% higher than in 2007. This is how those expenses break down:
16.6% – fertilizer, seed, crop-protecting chemicals
15.3% – purchased feed
12.2% – farm services
11.7% – purchased livestock and poultry
9.7% – farm labor and custom hire
8.3% – net rental payments
6.7% – machinery and vehicles
6.4% – interest, property taxes, other taxes/fees
3.3 % – fuel
9.8% – miscellaneous
Farm production expenses:
1997 – $157 billion
2002 – $173 billion
2007 – $241 billion
2012 – $328 billion
2017 – $326 billion
Ag programs equal 20% of the USDA budget
The total USDA budget in 2019 was $152 billion and the breakdown was:
71% – food assistance and nutrition programs
20% – ag programs
3% – conservation and forestry
6% – food safety, rural development, research, marketing and regulatory programs
The USDA’s budget focuses on creating jobs and building a foundation for future economic growth, particularly in rural America. It also provides stability for farmers and ranchers, in addition to making targeted investments in bio-based product manufacturing, local and regional food systems, and specialty crops and organic production. Food Assistance and Nutrition programs including the Supplemental Nutrition Assistance Program or SNAP (formerly known as Food Stamps); Women, Infants and Children or WIC; and school lunch/breakfast programs – account for nearly three quarters of the Agriculture Department’s 2019 budget. In contrast, ag programs equal just 20%.
Incidentally, did you know that President Abraham Lincoln established the USDA in 1862?
What does the 10-year federal spending look like (2019-2029)?
The total projected federal spending amount – $57.8 TRILLION and the breakdown would be:
$38.7 Trillion – healthcare, social security, net interest on public debt
$7.0 Trillion – national debt
$1.1 Trillion – agriculture baseline INCLUDING Food Assistance and Nutrition Programs
$150 Billion – agriculture baseline MINUS Food Assistance and Nutrition Programs
Information gathered from American Farm Bureau Foundation for Agriculture 2019.